Orange Bowl Probability Chart

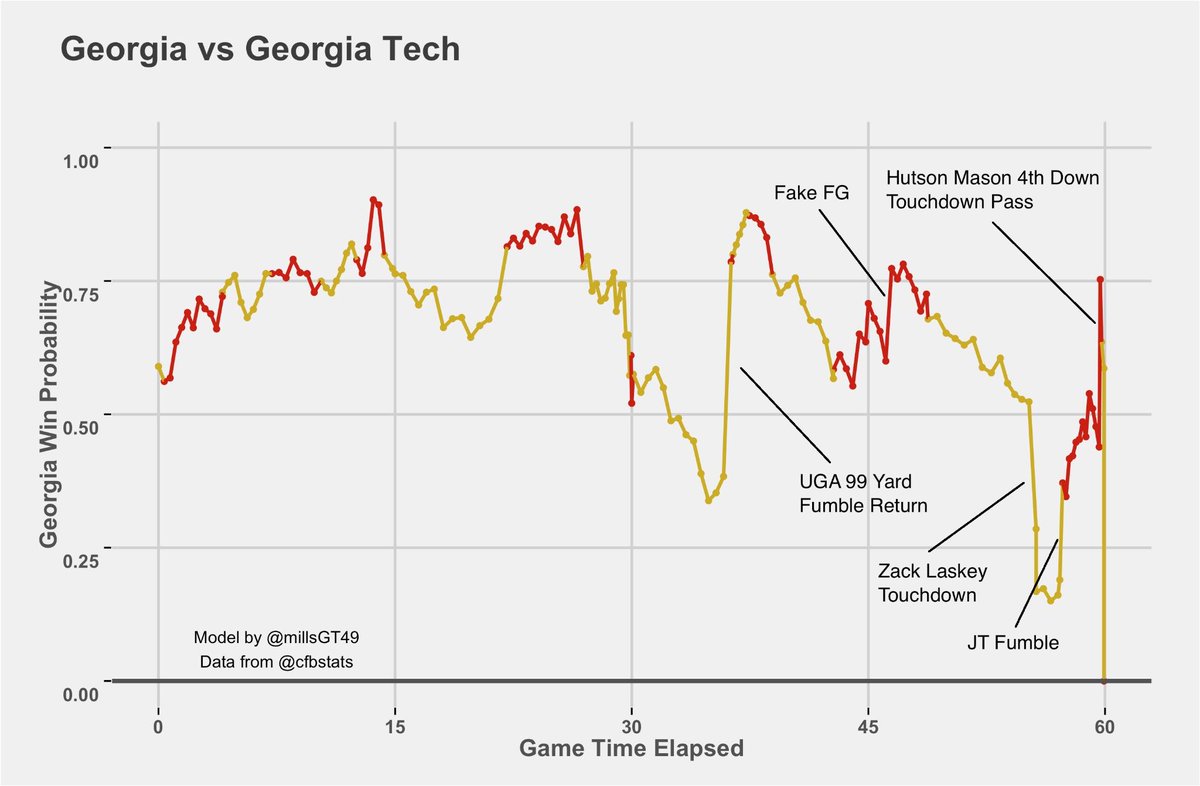
The hail mary and/or the fumble. Take those away in the 1st half and they're looking at a blowout of embarrassing proportions. I can't even remember too many breaks that we had in our favor. We just made plays on the 3rd down (when we needed 3 downs) and they just couldn't.

Fumble (even if we only convert it into a FG) is a 3 point swing, so 17-0 at that point (instead of 14-3). Then, enough time would have come off the clock to prevent hail mary, so halftime score 24-10 (vs. 21-20).

Take away their final garbage score at the end too and you have 52-17.

Final score made it seem way closer than it was.
 
We had the lead by a point and got the ball to start the 3rd... I'm surprised the probability was only 50% at halftime. Apparently this model considers team strength, as assessed before the game, throughout the game.

So the chart was essentially never below 50% and above 60% for most of the game. Is this what the playoff selection coven calls "game control"?
 
Game control stat only counts in SEC "good loss" games.
 
ESPN has a state called FPI they use (and they give to the CFP selection committee to use).

That Stat has:

  • GT as the #19 team in the country
  • Georgia as the #5 team in the country
  • 5 SEC teams in the Top 10, including Miss State and Ole Miss
  • 9 SEC teams in the Top 25, including Florida and has 7-6 Arkansas as a Top 15 team

I love how as soon as the phrase "game control" was said by the Committee chair, ESPN went into full damage control mode. You saw several explanations and questions about Game Control like no one at ESPN had heard of it either (in spite of the fact that it was listed among ESPN's FPI rankings as a criterion). Then ESPN also went out of their way to tell us exactly WHO supplies the stats to the CFB Committee, and that ESPN has no real input...right...ok.

I know a GT grad and I believe poster here is someone who supplies the Playoff Committee stats, but I don't think it's an exclusive source of information for the committee.

I also wonder about a potential COI at the data souce because it works with clients as teams as well as with the CFB Playoff comittee.
 
I don't know him personally, but I think cyptom does. It's Scott Prather a former pitcher on the baseball team.
His company is sportssource analytics.
 
SSA actually is the exclusive provider for the committee.
 
It cracks me up for the Miss St game that it was basically over and everything after 5 minutes left in the 3rd quarter was garbage time.
 
Is there one of these graphs for the Georgia game?

Nevermind found it

B3xgk_-IEAA7kV3.jpg

How did we still have a 25% chance of winning with 18 seconds left?
 
probably b/c it is only a 3pt game it keeps the probability at .75

The other graphs went super high when it becomes more than a 1 score game
 
I think the guy who did the modeling said it was more like edge effects on his model that prevented it from going as steep as it probably should have. He said he was going to tweak it somehow.
 
How did we still have a 25% chance of winning with 18 seconds left?


And why did we have 100% chance of winning when we tied the game? Methinks this is a fair bit less scientific than they'd like you to think.


Sent from my iPhone using Tapatalk
 
And why did we have 100% chance of winning when we tied the game? Methinks this is a fair bit less scientific than they'd like you to think.


Sent from my iPhone using Tapatalk

Well we only tied it as time expired, could be the model isn't yet able to handle the idea of overtime?
 
Back
Top